ECG interpretation is a fundamental skill for every medical professional. A systematic approach will help you identify both common and subtle abnormalities.
The Systematic Approach
Follow this 10-step checklist for every ECG:
1. Rate and Rhythm
- Normal rate: 60-100 bpm
- Regular vs. irregular: Check R-R intervals
- P waves: Present, upright in lead II?
2. Axis
| Axis | Lead I | Lead aVF | Interpretation |
|---|---|---|---|
| Normal | + | + | -30° to +90° |
| Left Axis Deviation | + | - | -30° to -90° |
| Right Axis Deviation | - | + | +90° to +180° |
| Extreme Axis | - | - | -90° to -180° |
3. Intervals
- PR interval: 120-200 ms (3-5 small boxes)
- QRS duration: < 120 ms (3 small boxes)
- QTc: < 450 ms (men), < 460 ms (women)
4. Hypertrophy
Left Ventricular Hypertrophy (LVH):
- S in V1 + R in V5/V6 > 35 mm
- Strain pattern in lateral leads
Right Ventricular Hypertrophy (RVH):
- R > S in V1-V2
- RAD with right atrial enlargement
5. Ischemia and Infarction
ST Elevation Myocardial Infarction (STEMI)
| Territory | Leads with ST Elevation | Culprit Vessel |
|---|---|---|
| Anterior | V1-V4 | LAD |
| Inferior | II, III, aVF | RCA |
| Lateral | I, aVL, V5-V6 | LCx |
| Posterior | V7-V9 (reciprocal) | RCA/LCx |
NSTEMI vs Unstable Angina
- NSTEMI: Troponin positive, ST depression/T-wave changes
- Unstable angina: Troponin negative, ischemic symptoms
6. Arrhythmias
Supraventricular Arrhythmias
- Sinus bradycardia: Rate < 60, normal P waves
- Sinus tachycardia: Rate > 100, normal P waves
- Atrial fibrillation: Irregularly irregular, no P waves
- Atrial flutter: Sawtooth pattern in II, III, aVF
Ventricular Arrhythmias
- PVCs: Wide QRS, early, compensatory pause
- V-tach: Wide complex tachycardia, hemodynamic instability
- V-fib: Chaotic, no organized activity
7. Conduction Blocks
Bundle Branch Blocks
- RBBB: rsR’ in V1-V2, wide S in I, V6
- LBBB: Broad notched R in I, aVL, V5-V6
AV Blocks
- First degree: PR > 200 ms
- Second degree Mobitz I: Progressive PR prolongation
- Second degree Mobitz II: Constant PR with dropped QRS
- Third degree: Complete AV dissociation
High-Yield ECG Findings
Brugada Syndrome
- Coved ST elevation in V1-V2
- Type 1: > 2mm ST elevation with T-wave inversion
- Risk of sudden cardiac death
Hypokalemia
- Flattened T waves
- U waves
- ST depression
- QT prolongation
Pulmonary Embolism
- Sinus tachycardia (most common)
- S1Q3T3 pattern
- Right heart strain
- RBBB
Clinical Correlation
Always correlate ECG findings with:
- Clinical presentation: Symptoms, vital signs
- History: Prior ECGs, cardiac history
- Laboratory data: Troponin, electrolytes
- Imaging: Echo, CXR
Practice Tips
- Read 10 ECGs daily: Pattern recognition improves with repetition
- Compare with normal: Know what normal looks like
- Use the checklist: Don’t skip steps
- Ask for help: When uncertain, consult cardiology
Resources
- Clinicapedia ECG Study Cards: Visual recognition cards
- LITFL ECG Library: Free online resource
- ECG Wave-Maven: Case-based learning
Conclusion
ECG interpretation is a skill that improves with deliberate practice. Use the systematic approach outlined here, and you’ll develop confidence in identifying both common and rare findings.
Want more practice? Check out our ECG resources →
Recommended Resource
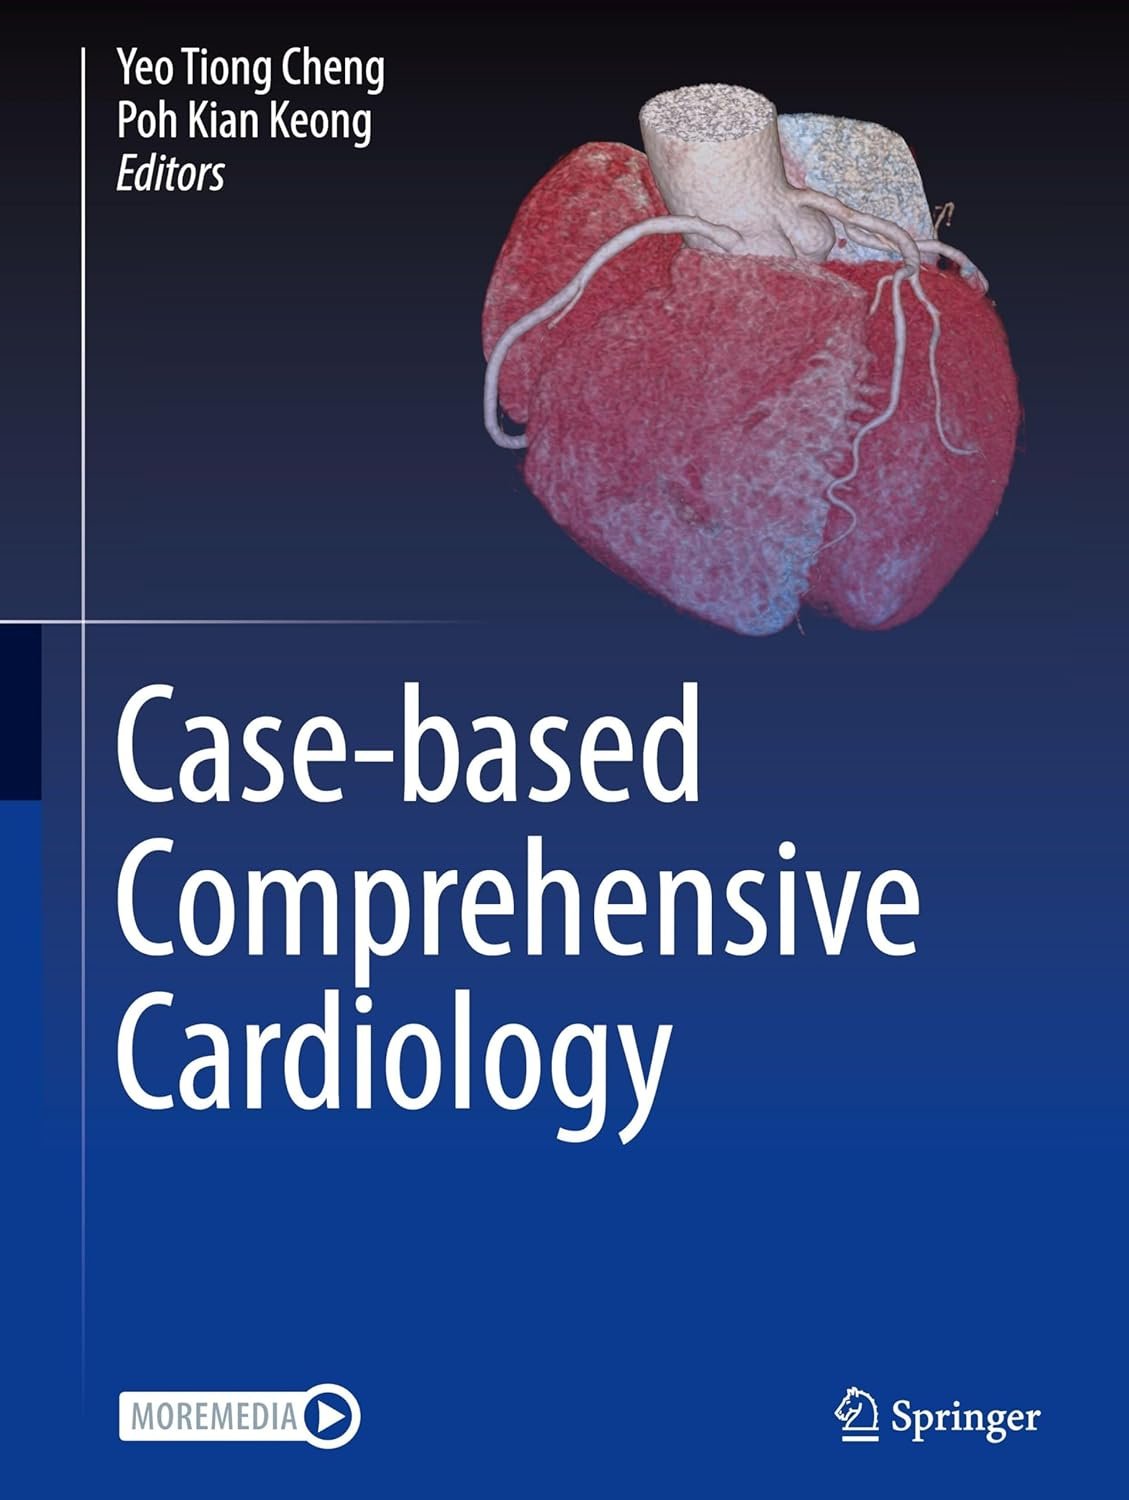
Case-Based Comprehensive Cardiology
Master cardiology through real-world clinical cases. The perfect companion to this article.
Get it for $2.99